
The stock market is in the middle of a 2-month trading range. While the bulls are hoping for a year-end rally to a new all-time high, the October selloff was strong. The range will probably continue for at least a few more weeks, writes Dr. Al Brooks Saturday.
That 2-month range is in the middle of a yearlong trading range.
Crude oil futures had an exhaustive sell climax this week. It has a 75% chance of leading to a trading range that is at least $5 tall. That is an unusually high probability.
The EUR/USD forex market broke below the neck line of a 2-month double top. However, there is a nested wedge bottom and a test of monthly support. Bulls will buy the first 1 – 5 day pullback. The market will probably go sideways in a 300 pip range for a couple of weeks.
Crude oil futures: Exhaustive sell climax
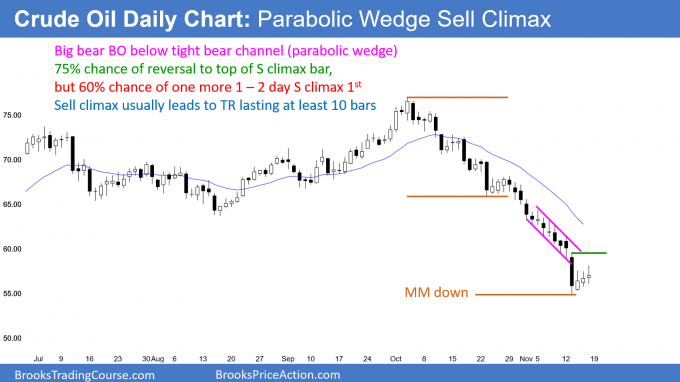
The crude oil futures daily chart broke strongly below a tight bear channel last week ending Nov. 16. It stopped exactly at a measured move down. This will probably be an exhaustive sell climax and the start of a trading range.
The crude oil futures market has sold off for 2 months. There have been 6 consecutive bear bars on the weekly chart (not shown). The daily chart had a huge bear bar on Tuesday (Nov. 13). It was the biggest bear bar in a bear trend that has lasted more than 20 bars.
When that is the case, there is a 60% chance that it is either the end of the selloff or there will be a brief second leg down that will end the selloff. After an exhaustive sell climax, a market usually enters a trading range for at least 10 bars. This means at least 2 weeks on the daily chart.
Tuesday also broke below a tight bear channel. A bear breakout below a bear channel reverses up 75% of the time within 5 bars. That is another reason why traders will look for a rally over the next couple of weeks. This is an unusually high level of certainty.
The first target for the rally is always the top of the most recent sell climax. That is Tuesday’s high of 59.54. I consider the space between Tuesday’s close and Tuesday’s high to be a gap. That gap will probably close within 2 weeks, making Tuesday an exhaustion gap bar.
The 20-day EMA is another target. The rally will then be the start of a $5 tall trading range, whether or not there is one more brief sell climax first.
Can Tuesday be the start of a crude oil crash?
Can Tuesday be a measuring gap and the start of an even stronger selloff instead of an exhaustion gap? Given what I wrote above, there is only a 25% chance of a big move down from here without at least a couple legs up over the next 2 weeks.
While the weak rally from Wednesday is a bear flag, the bulls will buy a new low. Consequently, the best the bears can probably get over the next week is a 1 – 2-day bear breakout. If they get it, it will probably fail. The odds favor at least a couple weeks of sideways to up trading.
EUR/USD nested wedge bottom
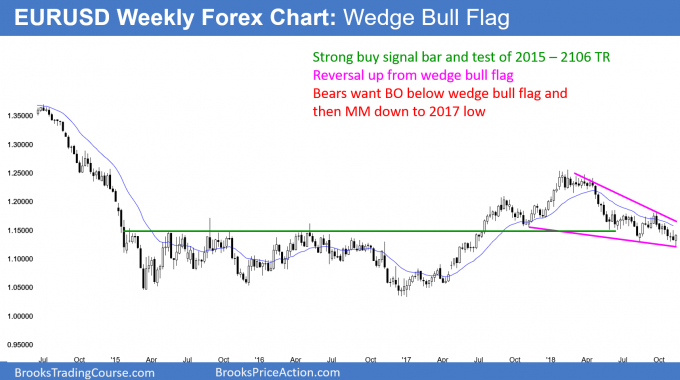
The EUR/USD weekly forex chart is reversing up from a wedge bull flag. The yearlong selloff is a test of the top of the 2015 – 2016 trading range. Last week formed a strong buy signal bar for this week beginning Nov. 19.
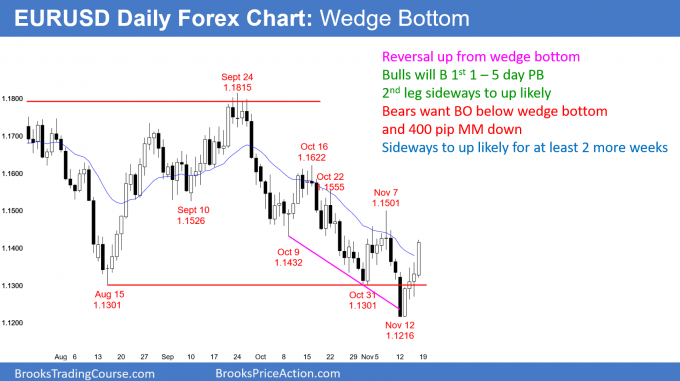
The EUR/USD daily forex chart reversed up from a wedge bottom. This is a failed breakout below the August 15 low. The odds favor at least a small 2nd leg up.
The EUR/USD weekly chart reversed up this week after breaking below the August low. The bulls now have an 11-week parabolic wedge bottom on the daily chart nested within a yearlong wedge bull flag on the weekly chart.
However, the past 8 weeks have been in a tight bear channel on the weekly chart. Last week’s buy signal bar is not enough buying pressure to overcome the tight bear channel. This is true despite the nested wedge bottom.
Therefore, if there is a reversal up, it will probably stall after a week or two. But, because of the wedge bottoms, the bulls will buy a resumption back down. That would create a micro double bottom. If the bulls then get a second buy signal, they would have a better chance of a swing up to the 1.1622 October 16 major lower high.
What about the July/September double top?
Whenever there is a double top bear flag and a reversal down, there is typically a 40% chance of a break below the neck line and a measured move down. Last week broke below the August low, which is the neck line of the July/September double top. The double top is 500 pips tall, and therefore the target for the bears is 1.08.
Is there a 40% chance of reaching 1.08 in this case? No. That is because there are other important factors in play here. In addition to the nested wedge bottoms, which are bullish, the yearlong selloff is testing the top of the 2015-2016 trading range. It is therefore a bull Breakout Test, which is a pullback to support.
Furthermore, look at the monthly chart (not shown). Four of the past 5 candlesticks were dojis. This is not how strong bear trends typically look. Therefore, the odds of the measured move down are less than 40%.
Monthly S&P500 Emini futures candlestick chart:
Weak rally from 20-month EMA
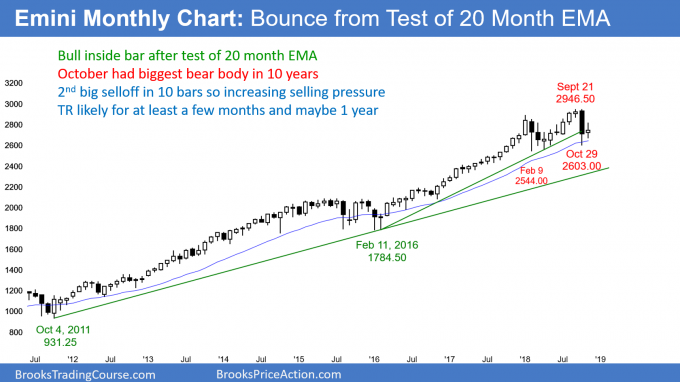
The monthly S&P 500 Emini futures candlestick pattern so far is a doji bar within October’s range.
The monthly S&P 500 Emini futures candlestick chart currently has a doji bar for November. This represents indecision and it increases the chance of more sideways trading for at least a couple months.
There are still 2 weeks left to the month. The bears hope for a late, strong selloff. They would then have consecutive big bear bars. While unlikely, it would increase the chance of at least several more months of sideways to down trading.
It is important to remember that the 10-year bull trend on the monthly chart has been strong. The 2018 double top is probably too small to reverse such a strong bull trend into a bear trend. Consequently, the past year is likely due to an absence of buying because the bulls were exhausted by the extreme buy climax in 2017.
Yearlong pullback from exhaustive buy climax
The 2016 – 2018 bull micro channel had 15 bars. This was the most extreme buy climax in the 100-year history of the stock market. Many bulls used the surprisingly strong rally as an opportunity to take windfall profits in January. They are waiting to see how low the Emini will fall before they will buy again.
Typically, exhausted bulls wait for at least 10 bars, but sometimes much longer. While the monthly chart has gone sideways all year, the October bear bar had the biggest bear body in the 10-year bull trend. In addition, the February bear bar was big as well. This strong selling pressure will make the bulls want to see a few bull bars before they buy again and hold for a swing up. As a result, the monthly chart will probably not be able to go up much for at least 2 – 3 months.
Can it go down? Yes, but probably not very far. The 1st reversal down in a strong bull trend tends to be minor. That means it forms a trading range or bull flag. Consequently, even if the Emini breaks below the February low, it will probably not enter a bear trend.
A trading range and then a new high would still be more likely than a bear trend with a test of the 2015 – 2016 trading range below 2,000. However, the Emini will probably test that level within the next 2 – 5 years.
Weekly S&P 500 Emini futures candlestick chart:
Weak buy and sell setups so sideways likely
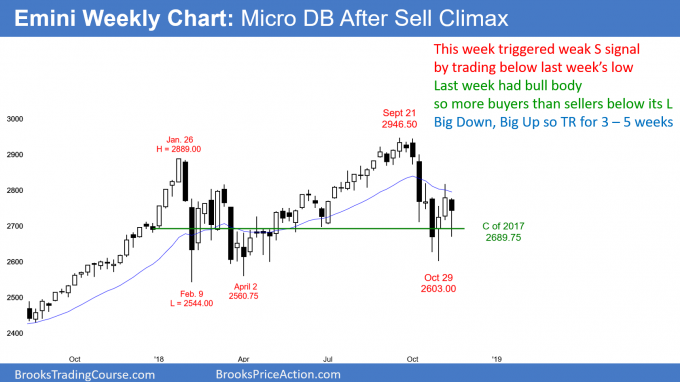
The weekly S&P 500 Emini futures candlestick chart triggered a Low 1 sell signal last week by trading below the previous week’s low. But, last week had a big bull body and the Emini reversed up 2 weeks earlier. Therefore, as was likely, there were more buyers than sellers below the previous week’s low. Last week closed above that low.
The weekly S&P 500 Emini futures candlestick chart had a buy signal a week ago and a sell signal last week. When there are conflicting signals and neither one is strong, there is confusion. Confusion is a hallmark of a trading range. Traders do not believe that the legs up and down will go far. They therefore take quick profits. In addition, whenever there is a strong leg up or down, they bet on a reversal instead of on a breakout.
The result is that traders are buying low, selling high, and scalping. This is how a trading range forms, and the 5-week trading range is likely to continue for at least a few more weeks.
Daily S&P 500 Emini futures candlestick chart:
Emini indecision with double top and head and shoulders bottom
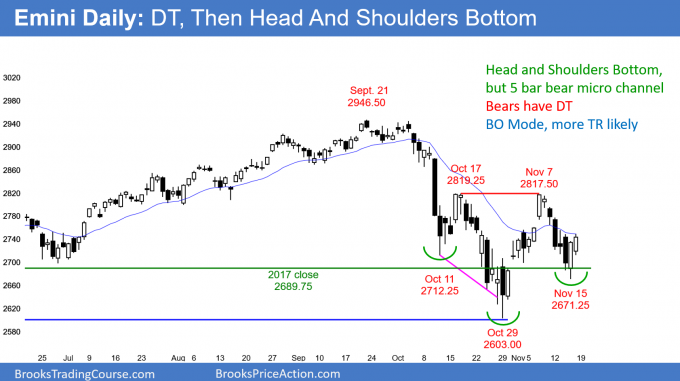
The daily S&P 500 Emini futures candlestick chart turned down last week from a 2-month double top bear flag. However, Thursday was a strong buy signal bar for a head and shoulders bottom. Friday triggered the buy signal by trading above Thursday’s high.
The daily S&P 500 Emini futures candlestick chart is in the middle of a 2-month trading range. In addition, that trading range is in the middle of yearlong trading range.
Trading ranges always have reasonable buy and sell setups. The bears have an October/November double top bear flag. But, the bulls have a 2-month head and shoulders bottom. Thursday was a strong buy signal bar, and the buy triggered on Friday.
While both the bulls and bears want a trend, trading ranges resist breaking out. Consequently, traders will look for reversals instead of trends. They will take quick profits after every 5 – 10 bar move, and then look for an opposite move.
Breakout mode
Which is more likely, a new all-time high or a break below the February low? Because there was a 10-year bull trend leading up to the yearlong trading range, a bull breakout has a higher probability. But every bar that gets added to the range makes the probability closer to 50% for the bulls and the bears.
The bulls hope that last week’s reversal up races to above the October/November double top. The bears, however, see the 4-day rally as a pullback in their reversal down from the double top. Both are valid patterns. The next few days will tell traders which is more likely.
Many bulls would like to see a test of last week’s low and then a second reversal up. That would have a higher probability of success.
Trading Room
Traders can see the end of the day bar-by-bar price action report by signing up for free at BrooksPriceAction.com. I talk about the detailed Emini price action real-time throughout the day in the BrooksPriceAction.com trading room. We offer a 2-day free trial.


