

Before we get into a review of the important facets of 2018, let’s look back and take a look at last year’s year end letter and take note of what we foretold, writes Nell Sloane, who makes three calls for 2019.
Here is what we wrote as to what we thought was in store for 2018 in terms of the equity markets, “Will the Fed’s rate hikes thwart this continued linear equity and debt boom? We don’t think so, we feel that the U.S. equity markets can continue their ascent into double digit percentages once again pushing the S&P 500 (SPX) toward the 3000 level and the NASDAQ finally breaking that 7000 mark.”
**
What we can say with certainty is that the S&P valiantly attempted to break 3000 but fell short as the high in the complex using futures was 2944.75 March future and, in the NASDAQ, the high in the March future was 7765 pushing it well past the 7k barrier.
The tech sector was once again the overall go-to market, as the FAANGs continued their lofty ascent, to only be brought back to reality as smart money began selling in late October.
Although the futures markets were looking at some decent gains on the year heading into November, the final two months of the year took all of the gains away. As of this letter and utilizing the futures markets, the S&P 500 trades at 2497 -6.4% YTD and the NASDAQ trades at 6330 which puts it down 0.8% YTD.
**
As for the FAANGs, let’s take a look in order from worst performer to best YTD:
Facebook (FB) -43% from its highs and is trading near $130 -26% YTD
Apple (AAPL) -37.6% from its high and is trading near $157 -7% YTD
Google (GOOGL) -24% from its high and is trading near $1033 -1.3% YTD
Amazon (AMZN) -36.7% from its high and is trading near $1517 +29% YTD
Netflix (NFLX) -45.2% from its high and is trading near $268 +38% YTD
As you can see even with the massive drop off from their highs, Amazon and Netflix are still up considerably YTD. That should provide you with some scope as to the veracity of outperformance by the tech sector in general this year.
**
Crude Oil was on track for a great year as it drove higher into October, rising some 33% YTD, but then the floor completely fell out from under it and is currently trading near $46, -40% from the highs and -20.3% YTD.
**
The metals complex saw a brief run up early in the year but then Gold fell around 11% by mid-year amongst the U.S. dollar (USD) strength on the heels of Fed rate hikes. However, by year-end Gold has recovered most of that loss and now trades around $1284, -1.6% on the year.
If the Fed is indeed near the end of the rate hike campaign and Gold has performed this well thus far, we can only imagine the bulls will continue to press the envelope here.
Don’t count out the other metals like Silver, which was down 20% by October but now trades $15.54 down 11.5% YTD.
Also, note Palladium, which after beginning down on the year some 22% it now trades at $1197 up 13.3% on the year.
Reuters: Fed will be patient, sensitive to risks, Powell says Friday.
**
The year 2018 was certainly one to remember as markets dealt with a massive equity run up in January, to be followed only by a complete CBOE Volatility Index (VIX) inspired market meltdown in February.
After that it seemed like the markets crept back into the linear buy-the-dip, algo-induced bravado which seemed to be kept somewhat in check by the rhythmic Fed and their 25bp rate hikes. The rate hikes continued to pound the U.S. yield curves flatter as the U.S. 2s10 yield curve flattened some 66% on their lows from 55 basis points down to 18 basis points the flattest level since June of 2007.
The curve has steepened a bit from those lows as professional bond traders place their bets that the Fed is near the end of their campaign. And their rosy outlook for continued hikes will be cut short of their mark set forth in their dot plot scheme.
As many pundits continue to clamor that an inverted yield curve assures us a recession is near, the long end seems to be well anchored in speculation that further hikes will be quickly retracted.
**
Central bank overlords: We have written exhaustively over the last decade in regard to the very simple game plan that the global central banks decided to embark upon. In 2008, with the initial passage of TARP and successive Quantitative Easing programs enacted by all the major central banks around the globe, the era of ZIRP commenced.
This precipice, this singularity if you will, vaulted global economies out of the worst debt-induced financial disaster since the Great Depression.
Investors the world around cheered in joy as asset prices bottomed, and both equity and bond markets rose rapidly. A more astute observer of financial constructs, like Jim Grant and David Rosenberg saw this as financial largesse at its finest as our central bank overlords swapped corporate and private defaulting debt, with AAA rated government debt in what would become the largest asset grab in history by global central banks.
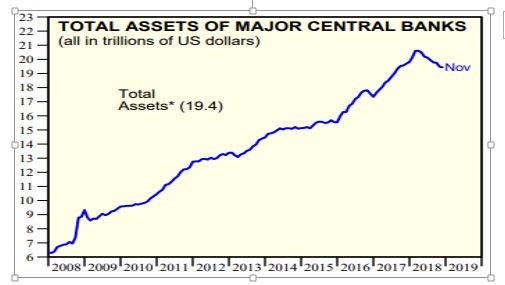
Anyway, with central banks cutting back their asset purchases and with the Federal Reserve continuing to raise rates, it should be of zero surprise to any investors that the global equity markets have been under attack. Yardeni Research posted a couple of great charts in their December issue and we have one right here:
**
As you can see, 2018 saw more than a trillion dollars being deducted from global central bank balance sheets. Just think of this as the first pillar of support to fall from under global equity markets.
**
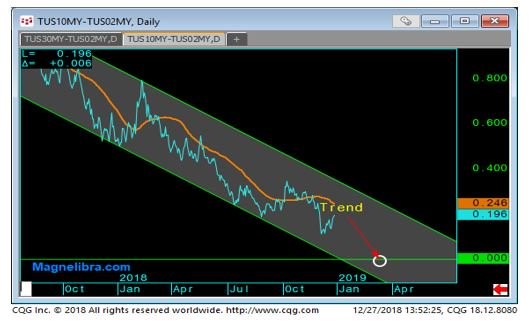
So, to enlighten you with our first call for 2019 the Federal Reserve will raise the Fed Funds rate up one more time to 2.75% inverting the Fed Funds/U.S. 10-year and the US 2s10 yield curve. The 2s10 has been hovering around the 20bp level for the last 5 months but we figure the Fed will raise rates at their March 19/20 meeting finally inverting this curve shown here:
**
Bearish Q1: This provides us with the ground work for our second call for 2019 and that is Q1 for the equity markets may see some carving out of this new-found equity market range.
Our view is still outright bearish, yet we aren’t naïve enough to just think an outright sell will not go untested.
We also figure a whole host of equity support will be coming in January as long-term liability matchers rebalance their portfolios to reflect this new-found equity market discount.
When was the last time you could pick up the FAANGs at such depressed levels? Remember many managers are still conditioned by the central bank “put” and “QE” lessons not learned are lessons not followed, so we expect this down turn to be a process, not all at once.
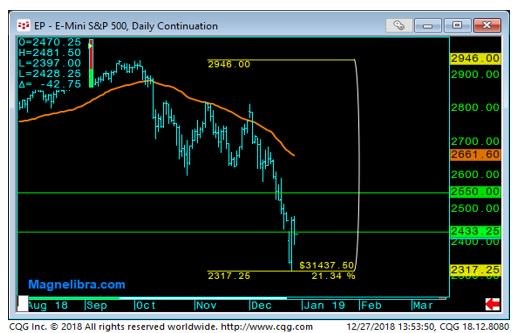
Anyway, this SP 500 chart shows the lows printing into bear territory but the last week of 2018 may see some salvation:
**
We suspect that the high is in for quite some time, but we will not rule out a run and test from here up toward 2650 in the S&P 500. Given the fact that the Fed is not expected to hike at the January meeting and that pension fund and insurer rebalancing may provide some decent support, this call seems logical at the moment. Obviously, things can and do change.
**
This brings us to our 3rd call for 2019 and that is China caves on U.S. tariffs and agrees to some concessions. This would obviously be equity bullish and we see it happening sooner rather than later as Trump is a master negotiator and is playing from the power position. Despite the naysayers, we feel the U.S. has the upper hand here.
China can ill afford a prolonged tariff spat and its most noted in their foreign reserve usage which continues to dwindle and is less potent at stemming capital flight out of the mainland.
You can’t peg your currency and stop capital flight as well, priority is important. We feel China can ill afford to play long ball with the U.S. in this manner.
**
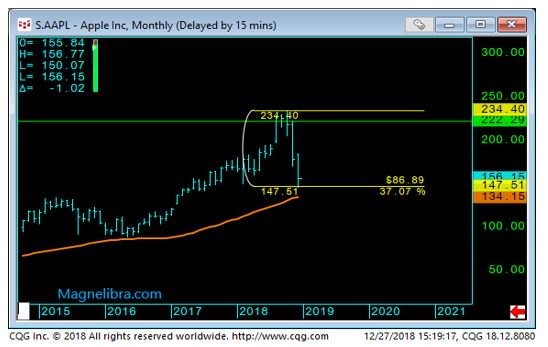
So, we spoke of some of the FAANGs earlier. Let’s take a look at some recent price action in Apple (AAPL). We talked at length this year about Apple and the fact that they have hit peak pricing and that their starting to see margin pressure build.
Reuters: Apple shares dive Thursday. Rare revenue warning drags global markets.
We have also noted that they have virtually staked their whole fate on just one product…never a good business decision, yeah, we know they have billions, but we also know they spend around $14.2 billion a year on R&D. (2018 SEC 10-k)
Behind Apple's fall: Saturation, 5G, Intel, QCOM. Sure, Trade & China too.
As far as support, a decent low has been hit here at $148 but ultimately the $134 area seems logical:
**
So just to recap the equity picture, we feel that Q1 2019 will see a whole host of bottom pickers come into support the markets.
First and foremost, the long-term liability players like pension fund and insurers will be rebalancing and adding to their current equity holdings as the recent drubbing will induce such activity.
On the flipside of that you have CTA trend following sellers looking to enter into what many now believe is an equity bear market.
So, all in all we think the equities move sideways to higher before that fateful March rate hike which will seal their fate.
**
China watch: We must be fully cognizant in the midst of this bearish mindset that any positive tariff news will certainly be bullish for equities, so be on the lookout for that as well.
**
As far as the U.S. government bonds, we touched upon the inversion that we expect in the U.S. 2s10 come March and now we will comment on the U.S. government 10-year bond. The recent break of 3% has seen a huge 30bp run toward the 2.70% area.
We expect some back and fill here as equities stabilize short term, but we feel the upside to yields is capped based upon or bearish outlook in equities and the fact that the Fed is near the end of their hikes.
**
The astute bond players will put the Fed into their place and begin front running future rate cuts. This we feel will most certainly be on the minds of bond traders in 2019.
Our target range for 2019 for U.S. 10-year yields are 3.05% to 2.30% with the upper bound most likely seen into the February refunding which will most undoubtedly be massive and the March Fed meeting.
The lower bound should be seen later on in the year as the Fed pauses and even contemplates reversing course depending solely on the severity of the equity markets moves. 2019 will be characterized by the Fed’s inability to remove QE and once again, its tendency to run to the only solution it knows, more QE or what we have coined as #QE4EVR.
Cheers,
Nell
If you would like to receive a copy of the one-page Featured Managers Report, just email us.
Subscribe to Nell Sloane's free Unique Insights and CryptoCorner newsletters here


