

With risk well-contained but future gains likely to be modest, Marvin Appel favors high yield corporate bonds.
The S&P 500 Index made a new all-time high on April 23. The NYSE advance-decline line confirmed this high. Our U.S. and international equity timing models remain bullish. I take the bullish readings from our indicators as suggesting that market risk remains below average, which of course is a good thing. However, I am cautious about the rate of future market gains over the next three months. Right now, the goal is to preserve the gains that have occurred so far in 2019 rather than looking to chase a breakout rally that might not extend very far. Rather, you should maintain your equity allocations.
In this environment where risks appear well contained but future gains could be modest, I continue to favor high yield corporate bonds as the area with the best risk-adjusted potential. If stocks do consolidate this year’s gains and move sideways, the 6% yields available from open-end high yield corporate bond funds will be quite attractive. But if the markets do turn down unexpectedly, high yield bonds should hold their value better than stocks. Of course, if stocks continue to power higher as in 2013 then they will leave high yield bond funds in the dust, but that is not a scenario I am projecting.
Small- and mid-cap ETFs have been weaker than large-caps. For example, while the S&P 500 Index has recovered all its losses from the 2018 peak, the S&P Midcap Index remains more than 5% below its 2018 peak. (See chart below.) In addition, the chart shows that the Midcap SPDR (MDY) has formed a clear negative divergence with its slow MACD.
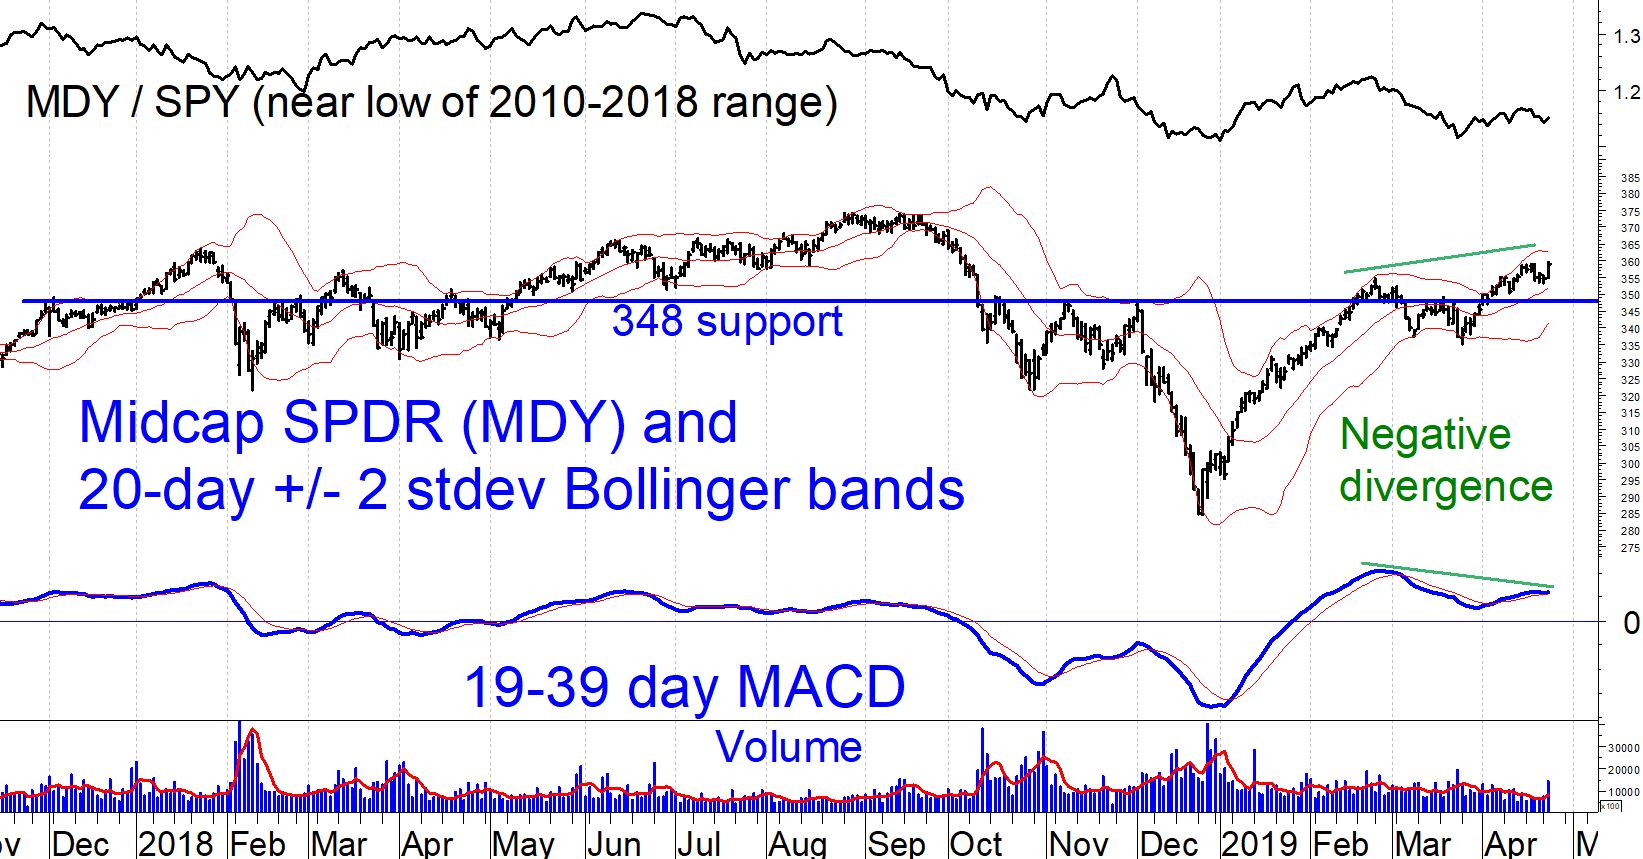
In contrast, the S&P 500 SPDR (SPY) formed a negative divergence which has since been cancelled by the recent move to new highs. Apart from the MACD divergence, the MDY chart is not too worrisome in the context of our bullish equity model readings because MDY is near a lot of potential support including the middle Bollinger band (352) and the 348 support area that is indicated on the chart. In fact, I would view a retracement to 348, 3.3% below the April 24 close, as a bottom fishing opportunity for as long as our U.S. equity model remains bullish.


