

With potentially market damaging political events going on, its time to see if it is matching with any of our timing models, reports Jeff Greenblatt.
People I know are split as to what the market will do next. So, if a picture is worth a thousand words, or maybe a $100 million, this is it. The best setup on the board for a 2019 top in the stock market can be seen in the Nasdaq 100 (NDX). It peaked in the 987 (Fibonacci) day window from the low of the 2015 correction (see chart below). From there, the high at 1091 points up was followed by a 92% retracement. That’s what I call replication, a cycle condition that repeats in creative ways and manifests excellent trading turns. Then again, the low is 7356.27 which is not only a point where supply met demand. It’s a typical chaos theory strange attractor which first attracts, then repels but ultimately becomes a navigational square out point. Notice how the high hits at 27 days from that pivot.
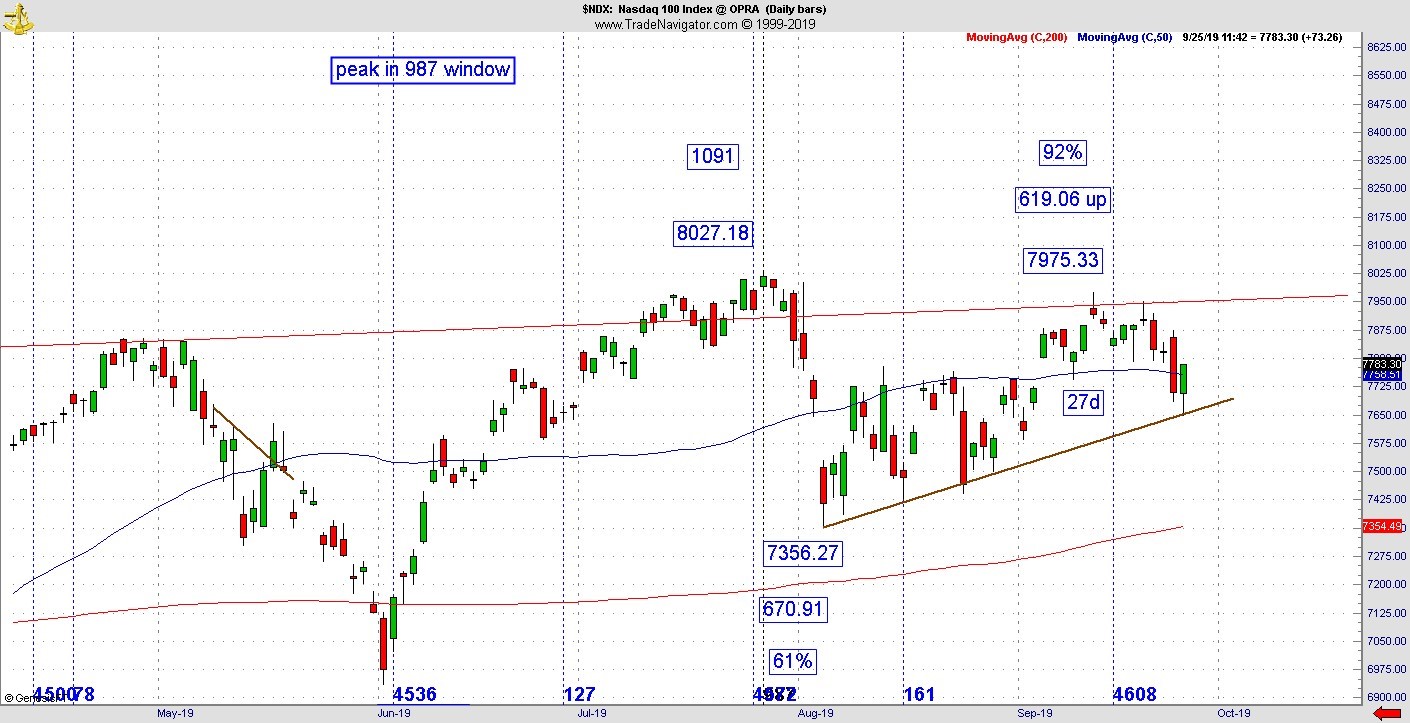
All of that being said, we have a simple connect the dots trend line where markets stopped going down for the time being. A break here could open the flood gates. What are we up against? Jeffrey Hirsch illustrates how the SPX has been down 23 of the past 29 years in the “Week After Q3 Triple Witching.” In our cycle work, we don’t focus on options expiration as much as the seasonal change point, which just so happened to materialize on the same day, last Friday. For the majority of the month, setups have been bullish. While some traders have been looking to the statistical horrors of September, the actual action has been different. Some people believe that since September has been bullish thus far it will remain that way. Think about it, last Thursday the Cboe Volatility Index (VIX) hit a near term low at 13.31. It was Friday where the intraday setups started turning bearish.
It could be the seasonality that drives stocks lower, but why does it always seem the most important financial news hits this time of year? Last week we learned the Federal Reserve was injecting $75 billion each night to make sure the banks had enough liquidity to do business the next day. According to numerous sources they will continue this action until Oct. 10. As of this writing, that means the Fed has already injected $600 billion or nearly 86% of the Troubled Asset Relief Program (TARP) bailout and they aren’t going to stop until that figure hits nearly $2 trillion or 3x the TARP bailout.
My problem is the market isn’t even asking how any of this is possible. But over the course of the year we’ve covered this issue. The world debt bubble was officially $233 trillion earlier in the year but that didn’t account for off-the-books derivative transactions according to Daniel Estulin who states the real number could be as high as $1-2 quadrillion. Bottom line for today is there appears to be a clear technical line in the sand if breached could be a gamechanger.
Over the years I’ve noted that when the cycle point matures, the news event manifests. The chart you see above for the NDX top just so happened to manifest the morning after Google (GOOG) earnings went through roof in the aftermarket the night before. For tech, that is the top. But let’s look at the kind of trading condition tied to a news event on a smaller time frame. Below is the 30-minute chart of Exxon Mobil (XOM) as it hit the oil spike 10 days ago on the Saudi missile attack.
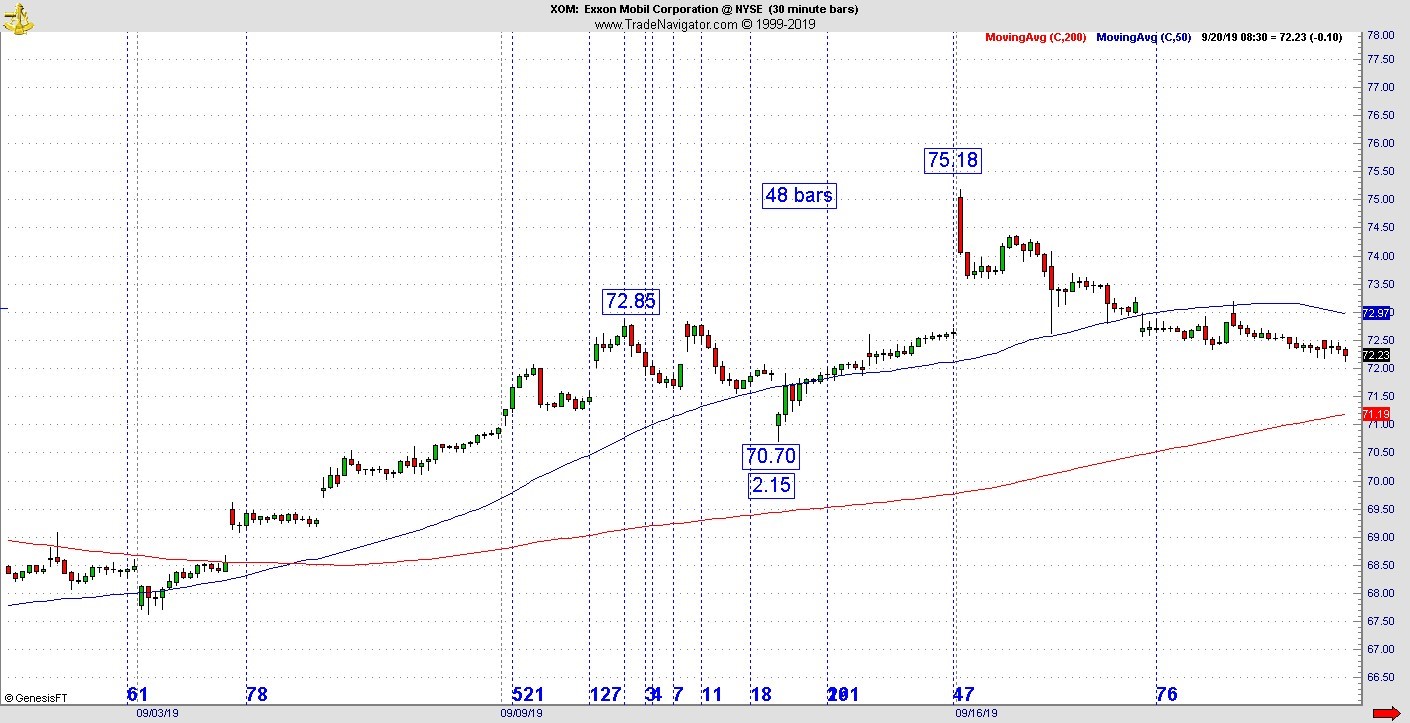
As we know, oil gapped up but stalled out. How would you trade that? Our Kairos square out methodology was a good navigational tool. We have a strategy called the Hi-Lo Power Sweep. Basically, it’s a cycle tendency where we look closely at the relationship of one leg to the next. In this case we take the high before the high to the high. Its 48 bars with a move up from 70.70 to 75.18, which is 4.48 or in terms of the vibration, just .48. So, the .48 is lining up with the time.
What makes a trade like this difficult is the psychological aspect of it. Here’s an oil spike based on a geopolitical event. Who would have the courage to go short? Perhaps a better question is not whether you would have the courage, but why would you get the courage to go short? The fact of the matter is the price has been lower right through Sept. 25, which is nine days later. Patterns are like snowflakes, while no two are ever exactly the same, the tendencies repeat. In this case, the relationship of three points, which square out happens all the time.
Wiring the brain through a process of neuroplasticity allows the trader the chance to renew his/her mind for success. What is neuroplasticity? You’ve heard it takes at least three weeks to learn a new habit, right? That’s because when we do a new activity, new neuropaths in the brain develop and grow. If you stick with it those little seedlings will grow into great oak trees. If you see about a hundred of these similar tendencies, you’ll start to trust what they are likely to do. It will be true even under situations that manifest in high pressurized news events. Never try this in real time until you practice to the point you are confident in what you are doing. In this case, the pattern was calling for a change of direction, it took a couple of days for the news to catch up as Saudi Aramco said the system would be repaired quickly and production levels restored by the end of the month.
If you want more information, go to: Lucaswaveinternational.com and sign up for the free newsletter.


