

Just as it appeared the euro was breaking out of its two-year bear trend, it makes new lows, reports Al Brooks.
The EURUSD currency pair made a new low in its two-year bear trend. Consecutive bear bars closing below the February low make at least slightly lower prices likely.
The EURUSD collapsed over the past two weeks (see weekly chart below) after breaking above the two-year bear channel. For the past year, I have mentioned many times that there was a gap above the April 7, 2017 high and that it was a potential magnet. The EURUSD low in February was 1 pip above the bottom of the gap.
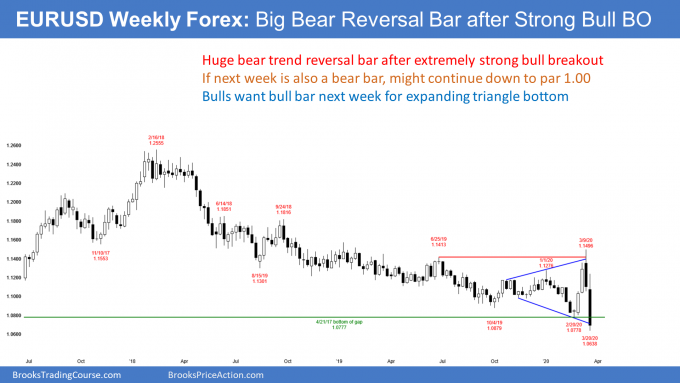
There was then a strong rally to above the two-year bear channel. Traders correctly concluded that the gap was successfully tested and the bear trend had ended. The weekly chart was either in a bull trend or a trading range as of two weeks ago.
With last week falling below the February low, the EURUSD made a new low in its two-year bear trend. But it could also still be forming a slightly lower low in its eight-month trading range. If there is a strong reversal up within a couple weeks, the EURUSD would be back to the middle of its eight-month trading range. It would therefore be more neutral, although slightly bearish after this week’s new low.
It is important to note that if the EURUSD weekly chart has a bear body and a second consecutive close below the February low, traders will expect a second leg down after the first one- to three-week bounce.
Furthermore, they will look for the selloff to reach the next support. That is the January 2017 low of 1.0340. If the EURUSD broke below that, the next support is at par (1.00).
Is last week’s bear break a bear trap?
What if this week’s candlestick has a bull body closing above the February low, or even at the high of the week? Traders will then suspect that this week’s breakout might fail. It might be a bear trap and the third leg down in an expanding triangle. The first two bottoms were the October and February low.
Any triangle is a trading range. Therefore, even though the EURUSD broke below a horizontal trading range, it is still possibly in an expanding triangle, which is also a trading range. However, on the daily chart (not shown), both Thursday and Friday were bear bars that closed below the February low. That makes at least slightly lower prices likely next week.
If the bulls this week get one or two bull bars on the daily chart, especially big bull bars closing near their highs, traders would suspect that the March breakout was a bear trap and the eight-month trading range was still intact. That rally would reduce the chance of a move down to par.
At the moment, the odds favor lower prices. They will change depending on what next week does.
Trading Room
Traders can see the end of the day bar-by-bar price action report by signing up for free at BrooksPriceAction.com. I talk about the detailed E-mini price action real-time throughout the day in the BrooksPriceAction.com trading room. We offer a two-day free trial.


