

An imminent break in Joe Duarte’s 50-50 Rule could signal big trouble for stocks.
Stock traders just got a wakeup call and the Federal Reserve, warts and all, seems to have been caught napping. As a result, the stock market is on the verge of reversing its current association with complexity, the positive forces of the Universe and trading it in for a date with chaos, the realm of disorder.
Purple Haze
Just six days into the official summer season, stock traders are suddenly seeing cloudy skies. Not only did the long heralded seasonal Saharan desert storm cloud that’s been clogging up the Caribbean of late finally hit the United States creating hazy sunsets and COPD exacerbations, but the stock market seems to have decided that it’s rallied far enough for now and that the bears are going to get a go at things.
Moreover, from a technical standpoint, there is now the imminent danger of a highly accurate technical signal which I developed, Duarte’s 50-50 rule which, delivering a sell signal, if triggered could lead to a significant decline in the stock market.
The Pavlov Market
Certainly a bumpy market is not altogether surprising, as I noted here two weeks ago and as I wrote in last week’s edition of this column: “As the traditionally sleepy summer trading season rolls into high gear, the combination of low volume and anemic liquidity from the Federal Reserve may make for a bumpy market,” which is exactly what happened.
And while the conventional wisdom says it’s all about the algorithms exacerbating the Covid-19 headlines, the decline in stocks is just as much about the reduction in the amount of Federal Reserve money being pumped into the U.S. Treasury bond market creating a liquidity vacuum in the stock market. In fact the Fed has gone from putting as much as $300 billion in a single day into the markets in mid-March, the act that kicked off the recovery rally for stocks, to its paltry by comparison $4 to $4.5 billion per day scheduled to be infused into the system during the month of July.
Sure, $80 billion is a lot of money to print in a month. Moreover, if you’re a purist, you’re asking why the Fed is papering over zombie debt in the first place. And you would be right on both counts.
However, from a trading standpoint, $4.5 billion a day, regardless of whether it is ultimately right or wrong from a fiscal and philosophical standpoint, or whether it has potentially negative repercussions for the future; is just not enough money to keep the stock market rallying in the face of Covid-19 uncertainty. (Just to answer those above questions; yes, it definitely will have negative repercussions, the question is whether the alternative was infinitely worse?)
Clearly, the algos have been conditioned by two major external factors. Like Pavlov’s dogs salivated each time they were presented with treats so do the algos react to every single headline and to the Fed’s market operations.
Thus, because there is no escaping the digital Pavlovian dynamic in this market, the bottom line is that either the Fed ponies up more helicopter money or the odds of a resurgence of the bear market are rapidly on the rise as the algos respond to the no bid market by lowering the bid-ask spread as they simultaneously short stocks accelerating the down side. Therefore, unless things change, the resulting reality could be another seemingly endless cascade of selling begetting more selling.
So as the next algo fueled mess develops, we should all ask these important questions:
- How bad does it have to get for the Fed to deliver another bazooka?
- How big will it be this time?
- Will it work as it did last time? And finally,
- Is the stock market finally going to deliver a real bear?
The cynical answer is that only the asleep at the wheel Fed and the Pavlov algos know.
Impending Sell Signal on NYAD 50-50 Rule
The New York Stock Exchange Advance Decline line (NYAD) has been the most accurate indicator of the stock market’s trend since the election of Donald Trump (see chart below). The 50-50 signal is very simple. As long as NYAD remains above its 50-day moving average at the same time that it remains above the 50 level on the RSI indicator, the trend in NYAD, and the stock market remain up. Moreover, breaks below the 50-50 areas are usually followed by meaningful market declines.
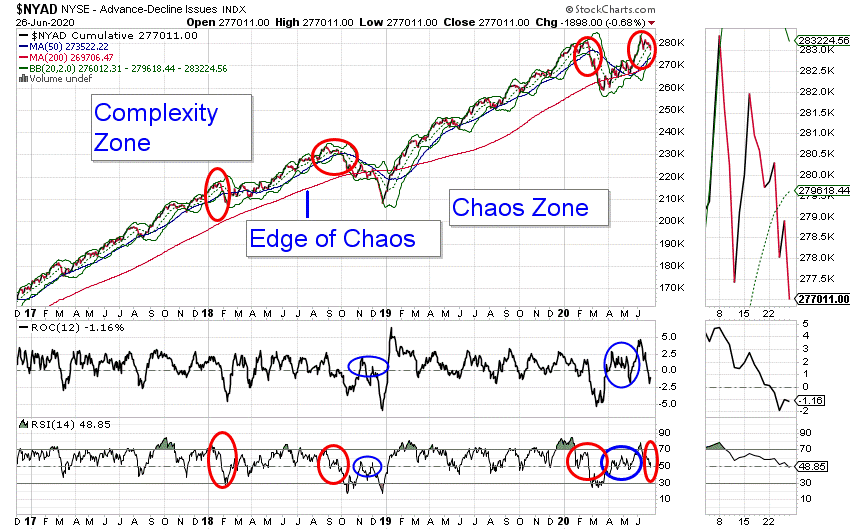
Unfortunately, after the market selloff on June 26, the NYAD 50-50 Rule is close to giving a sell signal as RSI broke below 50 while the advance decline line is on the verge of breaking below its 50-day moving average. Clearly, as the chart above illustrates, 50-50 sell signals on the NYAD are meaningful, and are marked on the chart by red ellipses.
Note that the S&P 500 fell 20% on the sell signal that occurred in October 2019 and that the most recent 50-50 sell signal triggered the 36% decline in SPX that ended in March 2020 when the Fed put $300 billion in to the markets in one day (see chart).
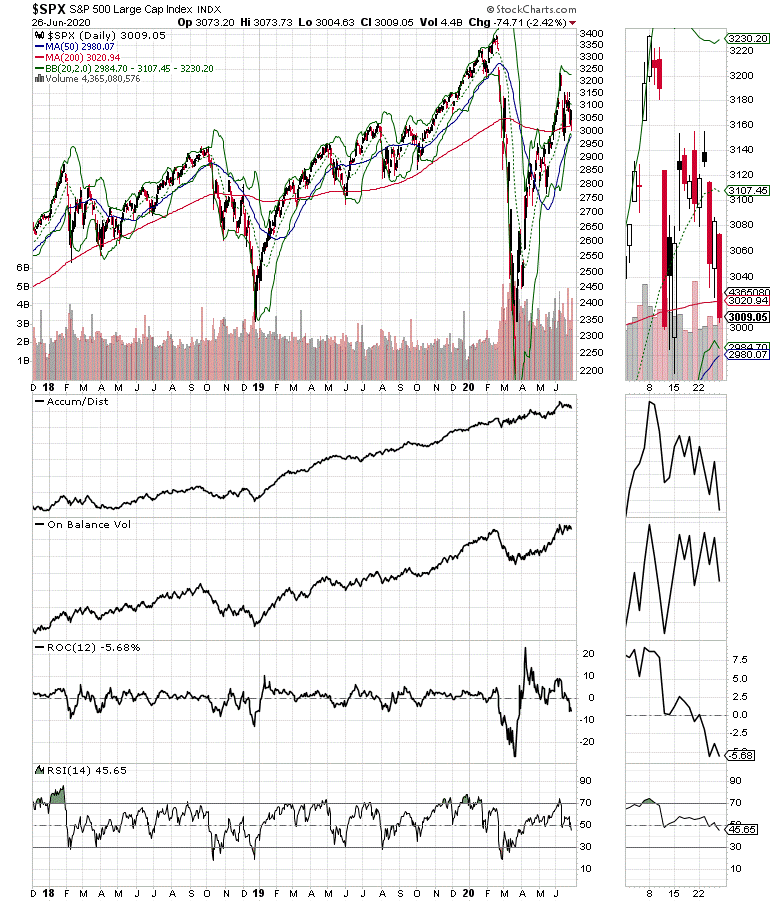
Moreover, highlighting further weakness in the market, the S&P 500 has broken below its 200-day moving average as well as triggering a break below the 50 area on its RSI indicator. Nevertheless, it is important to note that the NYAD gets the senior ruling as a 50-50 Rule sell signal in this indicator has more weight on the general trend of the market than the action in the major indexes.
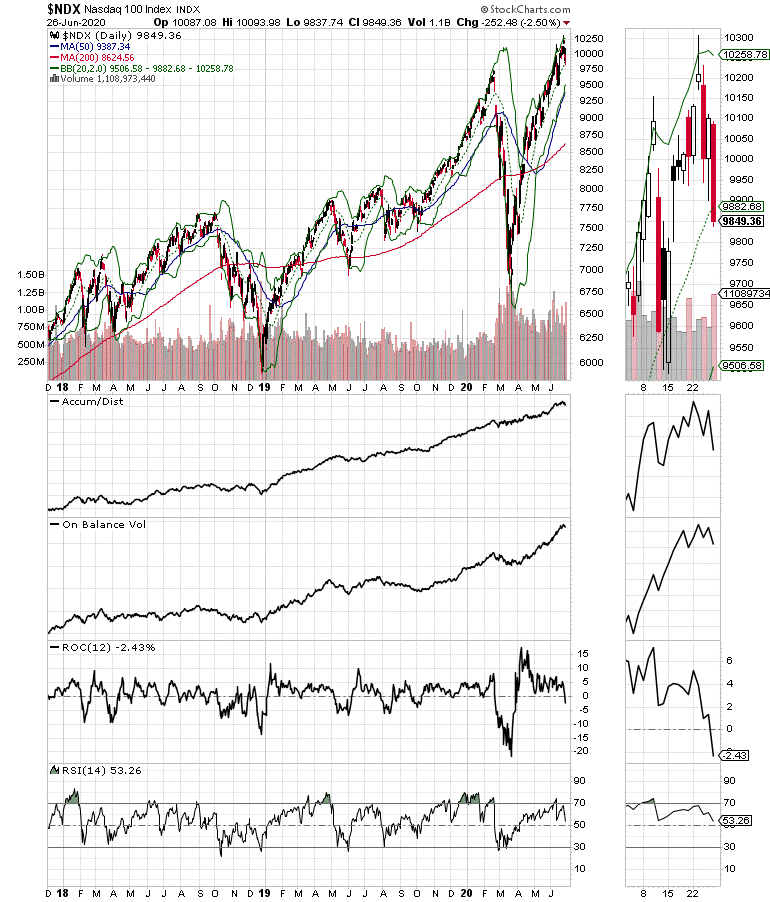
For its own part, the Nasdaq 100 Index (NDX) is nowhere near a 50-50 sell signal, which suggests that technology stocks, even as they fall, may not fare as badly as the more diversified sectors in the S&P 500. Moreover, some of the resilience in NDX is likely due to the muted selloff in the biotech shares housed in the index.
Welcome to the “Cruel, Cruel, summer”
Last week I posed the question of whether this would be a “Summer of Love,” or a “Cruel, Cruel, summer.” Well, with the stock market’s technical posture rapidly deteriorating and the Federal Reserve stuck in the mud, the odds favor a continuation of the downside action, at least in the short term. As a result, active traders should have started to raise cash, tighten sell stops and implementing hedges.
How low can this go? No one knows. The way this market has acted over the last few months, it could well set a new high in a few days. However, if the NYAD breaks below its 50-day moving average, a trip to its 200-day moving average is well within the normal technical expectation. That could translate into fairly steep losses for individual stocks and the major indexes.
I certainly could be wrong, and the market could find its sea legs and move higher. Moreover, the Fed could slow this process, and may be able to stop if they increase the amount of money, they inject into the bond market and the banking system. But, even if the Fed acts aggressively, there are no guarantees. So, it is now worth considering that if this goes on for another few days, we may be in for a great deal of pain.
Welcome to the cruel, cruel summer.
For more details on the summer trading season catch my most recent Your Daily Five installment here. To subscribe for a FREE trial to Joe Duarte in the Money Options.com, click here. I have compiled a small list of companies whose stocks are showing relative strength and may be worth owning. The list can be accessed via a FREE trial to Joe Duarte in the Money Options.com To subscribe to my service, click here


