
Traders should expect a breakout from the four-week range, which will eventually fail, says Al Brooks.
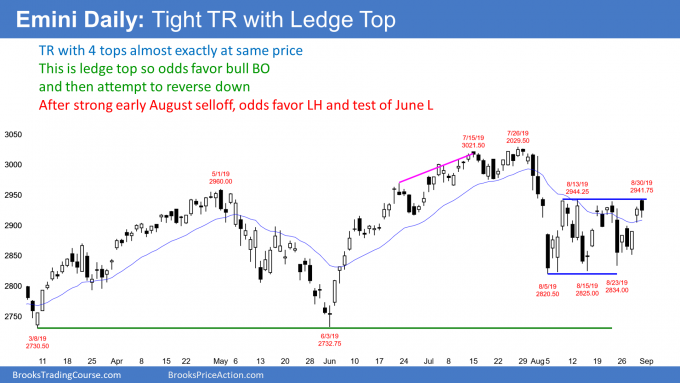
The E-mini S&P 500 has a ledge top on the daily chart. Traders should expect a breakout above the four-week range, but that breakout will likely fail and lead to a move below the August low.
The E-mini S&P500 futures chart triggered an “OO” (outside down bar followed by an outside up bar) buy signal on the monthly chart when July traded above consecutive outside bars in May and June. I have written about this every week since June. When an “OO” bull flag triggers, there is a 60% chance of sideways to higher prices for three bars. On the monthly chart, that means into September (see chart).
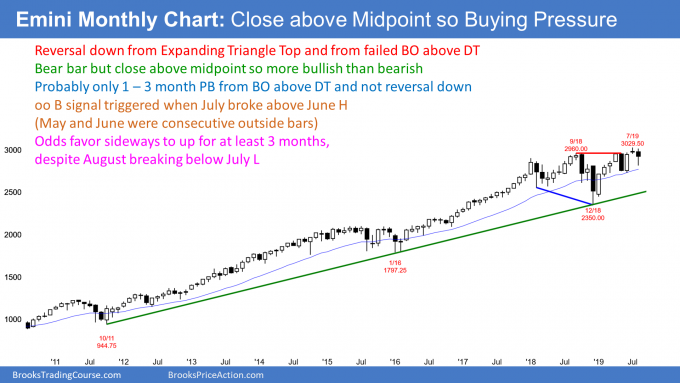
August was a big bear bar on the monthly chart until this past week. Then, the bullishness of the “OO” buy signal asserted itself. The E-mini rallied and August closed above the midpoint of the month’s range. While the month still had a bear body, the close above the midpoint means that the bulls won the month. It is a sign of buying pressure and strong bulls.
August would have been much more bullish if it rallied strongly from the first day and the month became a big bull trend bar closing far above the July high. Instead, the bulls achieved the minimum. They erased more than half of the selling and gave the bulls hope that the selloff has ended.
Since the August high is below the July high, August is a pullback in a bull trend. It is therefore a High 1 bull flag. But it has a bear body and the E-mini is at the top of a 20-month expanding triangle. That is a weak buy setup. Traders will not be eager to buy above the August high.
When a buy setup is weak, there are usually more sellers than buyers above the high of the buy signal bar. Therefore, September will probably not be a strongly bullish month.
Has the correction ended?
The selloff from the January 2018 high was mostly sideways for three months. The selloff in September lasted three months. Traders would not be surprised if the current selloff continues sideways for another month or two. Can the bears get a strong reversal down from the July high at the top of the expanding triangle? Probably not without more sideways bars.
The E-mini S&P500 futures formed a bull bar last week and it closed near its high on the weekly chart. Last week, therefore, is a buy signal bar for this week (see chart).
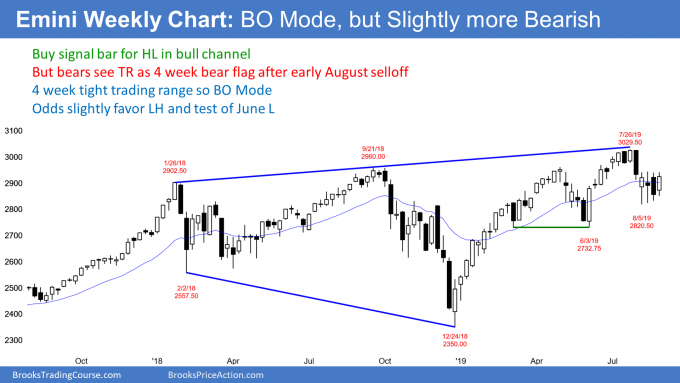
But there are problems for the bulls. Buying with a stop above a tight trading range and just below the 20-day exponential moving average is a low probability bet.
Furthermore, the August selloff from an expanding triangle top is likely to have at least a small second leg down. Consequently, while this week is a buy setup, there will probably be more bears looking to sell above this week’s high than bulls looking to buy.
What do traders need to see to believe that the 2019 bull trend is resuming? The bulls need at least two consecutive big bull bars closing near their highs and above the four-week tight trading range. More likely, a breakout above will reverse down within a couple weeks.
The E-mini S&P 500 futures reversed down again last week from the top of the August trading range on its daily chart (see chart). This is the fourth top in the trading range, and all four tops are almost exactly at the same price. That makes this a ledge top.
On the five-minute chart, the four or more highs in a ledge top are exactly at the same price. But the bars on the daily chart are much bigger than those on the five-minute chart. They therefore have many more ticks in each bar. With so many possible prices for the high, it almost impossible to have four bars in a short period of time with exactly the same high.
That does not mean ledges cannot exist on higher time frame charts. It only means they are not perfect. The closer they are to perfect, the more likely they will act like a ledge.
Why do ledges work?
I talked about the ledge bottom in Bitcoin a couple times over the past few weeks. I said there would be a break below $10,000, which happened this past week.
The E-mini now has a ledge top. You might sometimes hear that a triple top always has a bull breakout. While “always” is never true, some things have high probability. A ledge top is a quadruple top. It has a higher probability of a bull breakout than a triple top.
The E-mini keeps rallying to 2940. That has made it very easy to short there with a limit order. If something is easy, you must wonder if it is wrong. We should always assume that an institution is taking the other side of every trade that we take.
Why? Because they make up 95% of the volume. They are both sides of almost every trade and therefore probably the other side of your trade.
If it is easy for you to keep selling at 2940, then institutions are eager to buy from you at that price. Why? Because they see it as cheap, even though it is the top of the range.
At some point, the bears will become concerned that the E-mini is not going down. If enough of them buy back their shorts, there will be a break above the ledge. The remaining bears might then cover their shorts in a panic. The result would be a bull breakout.
Most breakouts come back to test the breakout point. That is why traders expect a test back below the ledge top. But will the reversal down be only a test or a failed breakout and the start of a swing down?
What happens after a ledge top?
When there is a ledge top on the five-minute chart, There is an 80% chance of a break above the ledge within two days. Furthermore, there is also an 80% chance of a pullback to below the top of the ledge within 20 bars after the bull breakout. At that point, the bull trend can reverse or resume.
How does that translate to the daily chart? Ledges are never perfect and are rare. That means there is more variation. Traders should expect a break above the top of the ledge within a couple weeks. They should then see a reversal back down below the top of the ledge within a couple weeks after the breakout.
The bulls hope that the pullback will be a bull flag. They want the breakout to continue up to a new all-time high.
The bears want the pullback to become a failed bull breakout and then a bear trend reversal. After such a strong selloff in early August, the bears still have a slightly higher probability of a break below the August low before there is a new all-time high. Consequently, traders should look for a bull breakout within a couple weeks and then a lower high that leads to a selloff to below 2800 within a couple months. A measured move down based on the four-week trading range would be around 2700.
Trading Room
Traders can see the end of the day bar-by-bar price action report by signing up for free at BrooksPriceAction.com. I talk about the detailed E-mini price action real-time throughout the day in the BrooksPriceAction.com trading room. We offer a two-day free trial.


