
One of the things forex traders might come across quite frequently is the so-called Big Mac Index. This might sound like a strange term, explains Konstantin Rabin of Finance Makers.
After all, what does this famous McDonald’s brand have to do with trading? Well, the Big Mac index, also known as BMI was invented by the British financial magazine The Economist, back in 1986. From that year onwards, this index has been updated at least once per year.
Here it is also worth mentioning that since 2006, 20 years after the introduction of the BMI, The Economist started publishing those reports twice per year. The Big Mac index measures the average prices of this burger in more than 40 countries on a regular basis.
Now, the main purpose of the Big Mac index is for traders and investors to be able to measure the relative undervaluation and overvaluation of currencies, based on the purchasing power parity indicator, also known as PPP. The PPP is an exchange rate at which the average prices for products and services will be equalized between two given countries.
Consequently, as the Big Mac index suggests, currencies whose exchange rates are below the PPP level are considered to be undervalued and are likely to rise in the long term against its peers.
At the same time, those currencies that trade above the PPP level are deemed to be overvalued and are likely to fall against other currencies at some point into the future. Therefore, the market participants can utilize the Big Mac index to make the relative currency valuations. Consequently, traders can then sell the overvalued currencies and buy the undervalued currencies.
Why The Economist Measures the Big Mac Index?
Anyone who is familiar with stock investing knows that there are indeed several measurements for valuing different stocks. One of the most important and frequently used measurements is the so-called price-to-earnings ratio, also known as the P/E ratio. The basic rule here is that stocks are deemed to be fairly valued if the P/E ratio is around 20. If this ratio is above 20 the stock is considered to be overpriced. On the other hand, if the P/E ratio is below 15, then the stock is deemed to be undervalued.
Now the problem here was that there was no P/E ratio equivalent in the forex market. Consequently, currency traders had a hard time valuing currencies and analyzing which ones were undervalued or overvalued.
So, this is exactly where The Economist’s Big Mac index comes into play, since it is mostly used as a tool for currency valuations. The fact of the matter is that The Economist started measuring the price of Big Macs in several countries in order to get some idea about relative price levels in different nations.
Here it is important to note that the employees of The Economist do not collect the price data just from a one single restaurant in a given country. Instead, they keep track of Big Mac prices of all McDonald's restaurants in several cities and then they calculate the average price for the given nation.
In order to understand this principle better, let us take a look how the Big Mac index is constructed in the US. When The Economist’s employees are collecting their data for the United States, they measure the average price of the Big Mac in the four largest cities in the country: New York, Chicago, Atlanta, and San Francisco. After collecting this set of prices, they then calculate the average price for those four largest cities and publish it in their annual report.
Here some people might still ask a very logical question: why did The Economist choose the price of the Big Mac for their analysis?
Well, firstly, it is important to point out that this product is produced in dozens of different countries by the same corporation. Consequently, it is easier to identify it and distinguish it from other hamburgers and similar products.
For example, if The Economist had chosen bread as a measuring rod for its calculations, then the task of collecting data would be much harder. This is because of the fact that there are dozens of different bread products produced by hundreds of different companies. However, with the Big Mac index, The Economist’s employees can simply walk in the local McDonald's restaurant and take note of the latest prices. So, there are no 20 different types of Big Macs to choose from, there is just one brand, which helps them to keep things simple.
It is important to note that Big Mac is a famous product across the world. It is essentially a quite affordable good and there are millions of people who consume it on a daily or weekly basis.
In addition to those arguments, it is helpful to mention that the price of the Big Mac itself represents a type of basket for goods and services. This includes the price of bread, beef, lettuce, sesame seeds, pepper, olive oil, mustard, garlic, paprika, cheese, onions, pickles, vinegar, mayonnaise, as well as the cost of transportation, electricity, rent, taxes, and labor.
So instead of taking note of the prices of all those goods and services and giving them different weights in the index, as with the consumer price index, the market participants can simply take a look at the price tag of the Big Mac and in this way get the latest information on the changes in the average price of this sort of consumer basket.
MoneyShow’s Top 100 Stocks for 2021
The top performing newsletter advisors and analyst are back, and they just released their best stock ideas for 2021. Subscribe to our free daily newsletter, Top Pros' Top Picks, and be among the first wave of investors to see our best stock ideas for the new year.
Examples of Overvaluation According to the Big Mac Index
At this point, it is important to recognize that there were several cases where the Big Mac index has correctly predicted the likely depreciation of some of the most overvalued currencies in the market.
In this article, we will just discuss three examples, involving the British pound, the Swedish krona, and the Norwegian krone. So, in order to get started with this sort of analysis, let us take a look at this weekly GBP/USD chart:
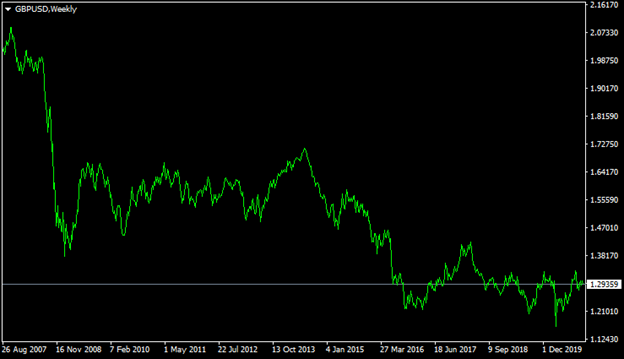
As we can observe from the above diagram, during the middle of 2008, the GBP/USD pair was trading close to the $2.00 level. At that time, The Economist’s Big Mac index suggested that the purchasing power parity level was at $1.56. In other words, this meant that the British currency was approximately 28% overvalued against the US dollar. Consequently, the index was predicting the sizable depreciation of the British pound against the USD at some point into the future.
As we can see here this prediction eventually turned out to be accurate, as the pound fell sharply before the end of the year, with the GBP/USD pair falling all the way down to the $1.40 level, before stabilizing within $1.50 to $1.65 range, which obviously included the purchasing power parity level as well.
This status quo has persisted for several years before the European Union membership referendum in the United Kingdom. As it became clear that the people of the UK have voted to leave the EU, this triggered a fresh downward trend for the pound, with GBP/USD currency pair trading near the $1.29 level by October 2020.
Now, in order to see another example, where the Big Mac index has predicted the exchange rate movements accurately, we can take a look at this weekly USD/SEK chart:
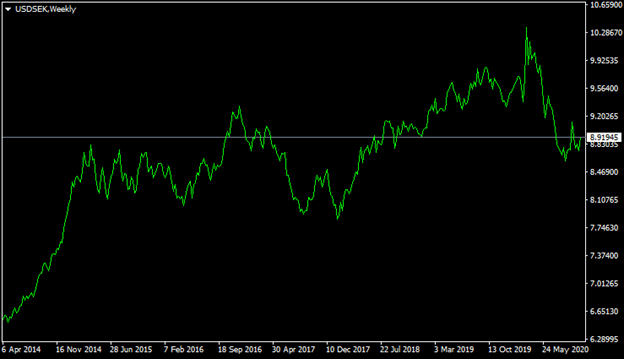
As the above chart shows, back in April 2014, the USD/SEK currency pair was trading near the 5.90 level. At that time, according to the Big Mac index, the fair value for the USD/SEK pair was at 8.80 level, which means that the Swedish currency was more than 49% overvalued against the US dollar.
This meant that the US dollar had a significant potential to make future gains against the Swedish krona. Those predictions turned out to be quite accurate, as the USD/SEK has appreciated considerably during the subsequent months and years. By 2020, the USD/SEK pair is trading near the 8.90 mark. This is much higher than back in 2014 and is also quite close to the purchasing power parity level we mentioned before.
Finally, we have yet another example, from this weekly USD/NOK chart:
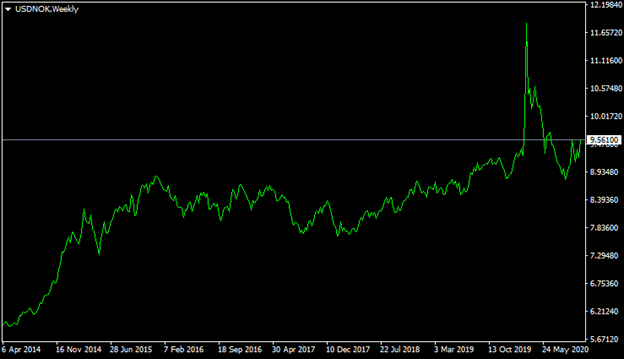
As we can observe from the above diagram, back in April 2014, the USD/NOK pair was trading close to the 5.85 level. At that time the latest Big Mac index report had suggested that the purchasing power parity level for the USD/NOK pair was at 10.38 level. So according to BMI, the Norwegian krone was overvalued by more than 77% against the US dollar.
Then it is not surprising at all that during the subsequent period, the US dollar has made some steady gains against the Norwegian currency, eventually rising all the way up to the 9.56 level by October 2020.
So, as we can see from those examples, in many cases the Big Mac index can be a valuable tool for identifying undervalued and overvalued currencies and also even predict the potential future currency movements.
This obviously does not mean that the Big Mac index is very helpful to scalpers or day traders. Such long-term dynamics as the purchasing power parity indicator has very little impact on the currency exchange rates with such short timeframes. So here it is worth keeping in mind that the Big Mac index is mostly useful for long-term traders, rather than for those market participants who typically open and close traders in a short space of time. This means that it might take several months or even years for the market to address the imbalance of the relative overvaluation and undervaluation of currencies and returning them back to the PPP levels.
By Konstantin Rabin of toponlineforexbrokers.com - a website reviewing online trading brokers.


