

A handful of sectors present on the relatively cheaper side of annual routines (Technology, Healthcare, Financials, Industrials, Materials). This week earnings must deliver, says Ziad Jasani in text and video commentary. He offers three scenarios this week.
Recorded: Monday April 30, 2018
Duration: 1:06:41
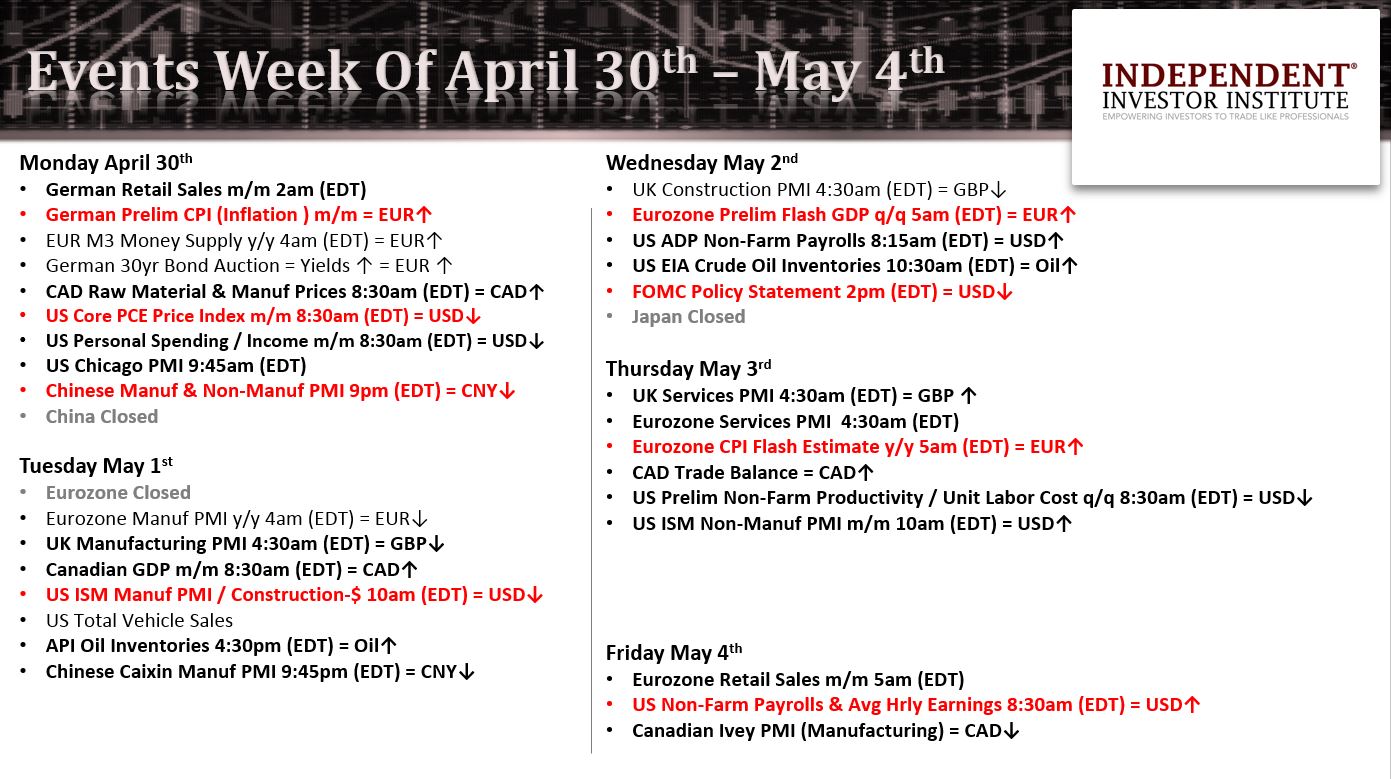
And Powell mustn’t use the May 2 FOMC statement to be a hawk to have any chance of Scenario A (Bullish) to play out or to remain in Scenario B (Indecision).
Eurozone growth is decelerating.
U.S. advanced Q1 GDP printed at 2.3% beating consensus (2%) but showed a marked slow-down from the back half of 2017 (~3%) while deficits are growing exponentially.
Technology earnings are in the rear-view mirror.
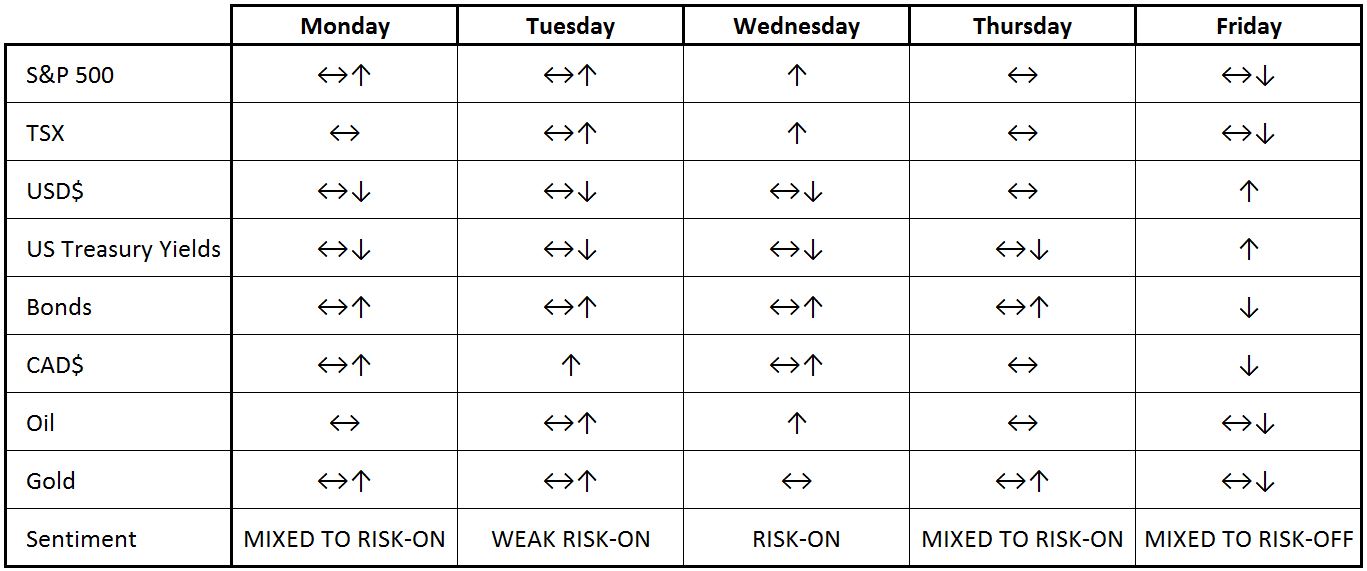
U.S. Treasury yields have cooled down, and the USD is expected to do the same (~only over the front end of the week ahead).
The S&P 500 remains below its 50-day average (2,688) and under the 50% retracement marker of the correction (2,703), despite strong earnings.
The TSX has popped above its 200-day average (15,625) as Oil has remained above its long-term 50% retracement marker ($66.89).
Canadian Financials have had some housing pressure taken off the banks on Poloz and a cooler CPI Print, but Oil must hold up along with the S&P 500 rising through its 50-day average for the TSX to continue its rise.
The following flow is currently highest probability to play out:
3 scenarios for the week ahead (Note: Above flow is Scenario A or B, not C)
• (A) BULLISH ↑: Signal à S&P 500 directly rises and holds above 2,688 (50-day average)
• (B) INDECISION ↔: Signal à S&P 500 < 2,688 but > 2,645 with swing-low formation
• (C) BEARISH ↓: Signal à S&P 500 < 2,620 and/or breaks 200-day average (2,611) and stays below heading to 2,417 (late summer 2017 lows).
In the case of Scenario A or B presenting the following spaces and decisions are viable on a swing trading basis:
• US EQUITIES: S&P 500 (SPX), Nasdaq (QQQ), Dow (DIA): Hold-To-Buy if S&P 500 > 2,645, 2nd Buy if S&P 500 > 2,663. If the levels break de-risk, target bounce again up off 2,620 • OIL: Longs Hold if Oil > $68 |Hold-To-Buy if Oil > $69.50 (USO, HOU-T) |If < $66.89 Sell
• GOLD: Hold-To-Buy if Gold > $1,331 to play to $1,355; 2nd Buy > $1,365 | Sell < $1,331
• BONDS: Hold if 10-year U.S. Treasury < 3.07%; If > 3.15% Sell | If < 2.7% Buy
• USD (UUP, EUR/USD): Sell if UUP < $23.95; if >$24.10 Buy, if < $23.75 ST Sell, if 15,625 | Short-Term Sell if TSX < 15,570 | Long-Term Sell if TSX $76.60 or $77.28 or while USD/CAD < 2,645: Buy SH, RWM, PSQ, DOG, HXD-T | second Entry S&P 500 < 2,620
• If the S&P 500 < 2,611 (200-day average) it would signal the third leg of short/inverse trades
• If the TSX breaks below 15,450 (50-day average): Hold-To-Buy HXD-T
• If the TSX breaks below 15,295 it would signal the second leg of short/inverse trades
• If the S&P 500 breaks below Feb. 9 lows (2,533) and remains below and longer-term investors would reduce long-side exposure by 33% to 50%
• If the TSX breaks below Feb. 9 lows (14,786) and remains below, longer-term investors would reduce long-side exposure by 50% to 70%.
Please join my free Introductory Active Investing Workshop on Saturday, May 5, 2018 from 12 pm – 3 pm (EDT): Click here to register
View the Independent Investor Institute trading ideas and strategies videos here.


